
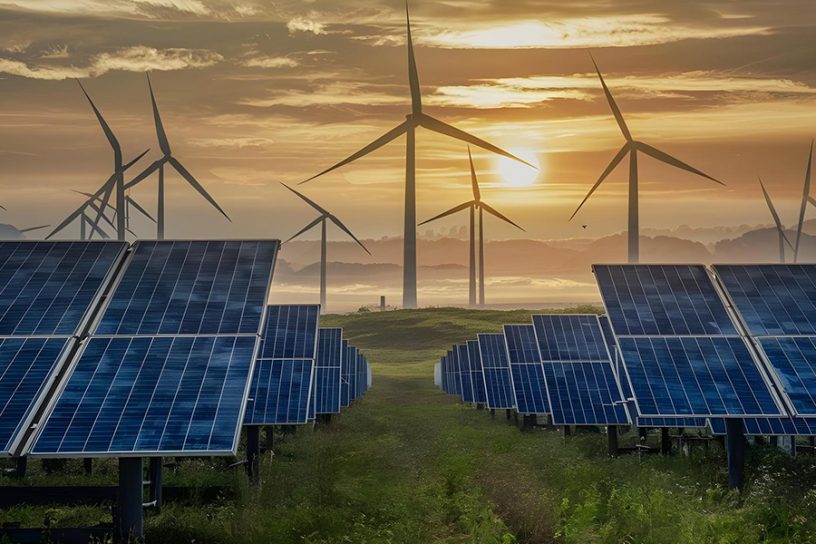

Indian ports show strong seasonal wind and wave energy potential, peaking during June–August (JJA) based on 44-year ERA5 analysis.
Authors
Prashant Kumar, Department of Applied Sciences, National Institute of Technology Delhi, Delhi, 110036, India
Ramakant Prasad, Department of Applied Sciences, National Institute of Technology Delhi, Delhi, 110036, India
Kamlesh Kumar Saha, Department of Applied Sciences, National Institute of Technology Delhi, Delhi, 110036, India
Anurag Singh, Department of Computer Science and Engineering, National Institute of Technology Delhi, Delhi, 110036, India
Prasad Kumar Bhaskaran, Department of Ocean Engineering and Naval Architecture, Indian Institute of Technology Kharagpur, West Bengal, Kharagpur, 721302, India
T. M. Balakrishnan, Applied Research and Research to Operations (ARO), INCOIS, Hyderabad, India
Anindita Patra, Electricity de France (EDF), Research & Development (R&D) Group, Palaiseau, France
Vinita, Department of Applied Sciences, National Institute of Technology Delhi, Delhi, 110036, India
Rajni, Associate Professor, Jindal Global Business School, O.P. Jindal Global University, Sonipat, , Haryana, India
Summary
Understanding the spatio-temporal evolution of wind and wave energy is essential for optimizing renewable energy extraction and identifying suitable sites for infrastructure development. This study assesses the combined potential of wind, swell, and wind-sea energy along major Indian ports using 44 years (1979–2022) of the ERA5 reanalysis data, validated against buoy and altimeter observations. Extreme value analysis is conducted using the generalized extreme value (GEV) method. Among six major ports, the highest swell and wind-sea power increases are observed at Kandla (1.33 kW/m/decade) and Mumbai (0.1 kW/m/decade) during June–August (JJA) and September–November (SON). The most significant rise in wind energy occurs at Mumbai (2.47 W/m2/decade) and Kochi (2.39 W/m2/decade). Peak swell power at Kandla reaches 66.84 kW/m, while wind-sea power peaks at 62 kW/m during JJA. The extreme wind energy is recorded at Kandla, averaging 0.51 kW/m2 (peaking at 3.65 kW/m2). JJA emerges as the most promising season for renewable energy generation, followed by SON. The findings highlight substantial renewable energy potential along the Indian coastline, emphasizing the need to account for seasonal variability and regional climatic influences when planning coastal energy initiatives. The analysis supports sustainable energy development and strategic planning along India’s coastline.
Published in: Journal of Water and Climate Change
To read the full article, please click here.
